The Problem
Unfortunately, like nearly every other distributed applications, SPOK offers little in terms of availability monitoring. Sure, you can monitor the various services. But the application has been observed to fail even with all of the services happily running.
So how do we monitor an application that is running but not working?
The Context
Luckily, the team that developed SPOK implemented some great logging for their application. And if you've got a monitor focused on the server, you can just have the agent look for certain event IDs in the standard Windows event logs, right?Well, no, actually. Because SPOK's logging is done via a text file, which is preferable, actually; the level of detail that can be stuffed into an application-specific logfile would overwhelm a standard Windows logging facility. So how do you deal with a logfile when you're using Microsoft SystemCenter Operations Manager 2012R2? (And why is SCOM such an awful thing to pronounce?)
The Solution
I should have started out by saying that I really don't like SCOM. It's clunky, the operations console is a huge waste of screen real estate, and the dashboards are so limited that you shouldn't even waste the time to set them up. SCOM is awful. Oh, all of these things will be fixed in the next version, you say? #idgafBut in IT, we are often constrained to use the tools we have, not the tools we want.
So I set out to see what SCOM could offer in this case. And I was pleasantly surprised to find that SCOM has a very capable logfile monitoring feature to address this very problem.
First, Find the Facts
The first step was to review the SPOK logfile and identify two patterns:- A pattern to indicate a healthy to unhealthy state change, and
- A pattern to indicate an unhealthy to healthy state change.
The first pattern was determined to be "Error sending handshake response: Client not connected." We observed that whenever the application fails, this exact message is logged. So we knew what to look for in order to denote the start of a problem.
The second pattern was more difficult to identify. I looked for a series of log entries that coincided with a server restart, which gave me what I was looking for: a clean set of startup messages in the logfile. It turns out that every time the application successfully connects to its network of servers, a specific message is logged: "Protocol supported. Sending response."
(If you're asking why we wanted two patterns to look for: my goal was to set up a monitor in SCOM that would detect the problem and create an alert, which in turn sets off a series of events thanks to the integration we created between monitoring and ITSM solutions. But I also wanted to have this alarm auto-close and auto-clear if the application recovers. That functionality depends on a second pattern to indicate the application's return to a healthy state.)
I finally had the data I needed to set up the monitor. And in case it's not obvious: you should collect as much information as possible before you even log into SCOM.
Creating the Monitor
Fire up the Operations Manager console and select the Authoring tab. Then navigate down to Authoring | Management Pack Objects | Monitors on the left of the console. On the right, navigate to Windows Computer | Entity Health | Availability. Right-click Availability, then choose Create a Monitor... Unit Monitor.

The Event Reset option highlighted above is what I wanted in this case: one state for healthy, the other state for unhealthy. And I chose to create a new management pack for this monitor, to keep it separated from the rest of the SCOM deployment.

Because names are important, I gave the new monitor a good name: SPOK Logfile Scraping. This may seem like a detail that's not worth mentioning. But I'll counter that many objects get deployed into production with stupid names like "Test1" and "Demo1", and then people develop a phobia for changing these names for fear of breaking something, So use good names. Always. And make the description meaningful, too. Because what you create today will be examined by someone else long after you've moved on to a new position. This is your chance to document as you create; don't squander it.

The next step is not intuitive, so it warrants discussion.
 |
| Zork. The greatest IT simulation of all time. |
In the Directory field, you enter the path (UNC in this case because the logfile is on a remote Windows server) to the logfile directory. You'll be tempted to include the name of the logfile here; do not give in to said temptation.
On to Pattern. In this field, you describe the pattern for the names of the logfiles to be monitored. For example, if your application rotates logfiles once a day, the filename may configured to include the current date. And because that configuration results in logfiles that will always have a unique file name, you have to use a pattern that is ambiguous enough to account for changes in filenames, but specific enough to identify the logfiles you want to watch. Easy, right? I went with amc*log.txt, which worked like a charm.
It's now time to create the first expression. This expression will trigger the unhealthy state alert, so we'll use the first pattern identified. But the trick here is the Parameter Name. For log scraping, the Parameter Name must be set to Params/Param[1]. Set the Operator to Contains (because the log entry will surely contain a time and datestamp along with the pattern we're matching on). And finally, paste that text "Error sending handshake response: Client not connected" into the Value field. Your first expression is now complete.
The second expression will trigger the return of the application to a healthy state. The configuration is identical to the first expression, with an obvious exception: we're now looking to pattern match on "Protocol supported. Sending response" because this pattern indicates a successful application startup.
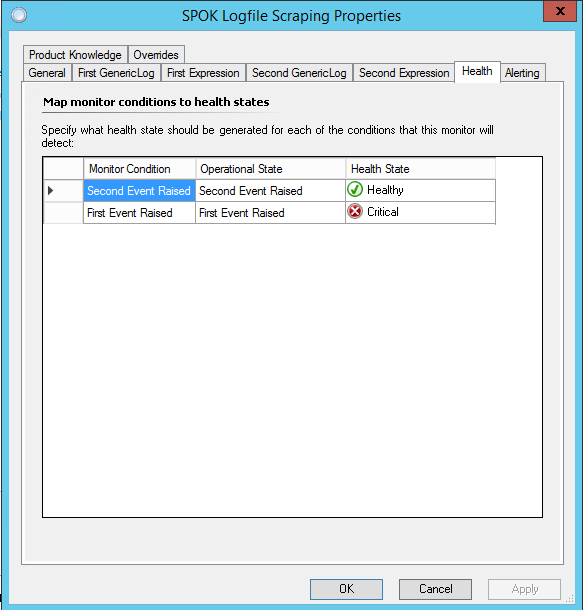
On to the Health tab. Here, we'll correlate the two expressions with their health state. Easy. Basic.
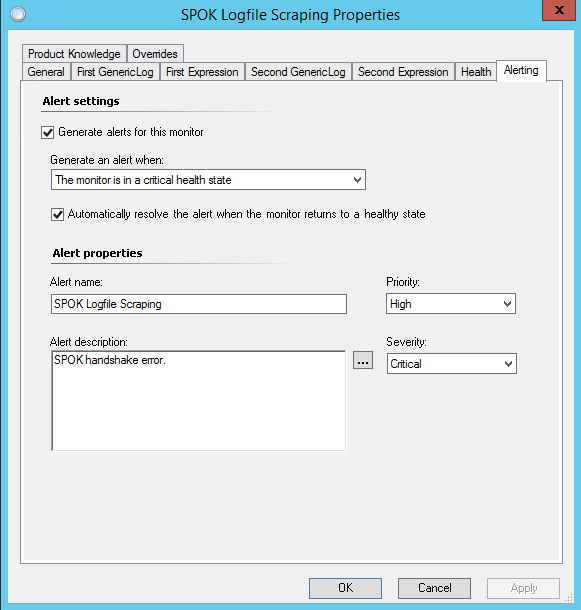
Finally, we configure the Alerting. Because that's the whole point of going through this exercise.
Choose to generate alerts for this monitor, and generate an alert when the monitor is in a critical health state. The first expression enables this functionality. Next, choose to automatically resolve the alert when the monitor returns to a healthy state. The second expression enables this functionality.
Use a meaningful name and description for your alert; these bits of information will appear in the operations console, and in the data sent via integrations with other software. Finally, set the Priority and Severity, based on the application's role in your environment (in my case, the paging system for a busy hospital was considered pretty goddamned important, as one could guess).
It's now time to create the first expression. This expression will trigger the unhealthy state alert, so we'll use the first pattern identified. But the trick here is the Parameter Name. For log scraping, the Parameter Name must be set to Params/Param[1]. Set the Operator to Contains (because the log entry will surely contain a time and datestamp along with the pattern we're matching on). And finally, paste that text "Error sending handshake response: Client not connected" into the Value field. Your first expression is now complete.
The second expression will trigger the return of the application to a healthy state. The configuration is identical to the first expression, with an obvious exception: we're now looking to pattern match on "Protocol supported. Sending response" because this pattern indicates a successful application startup.
On to the Health tab. Here, we'll correlate the two expressions with their health state. Easy. Basic.

Finally, we configure the Alerting. Because that's the whole point of going through this exercise.
Choose to generate alerts for this monitor, and generate an alert when the monitor is in a critical health state. The first expression enables this functionality. Next, choose to automatically resolve the alert when the monitor returns to a healthy state. The second expression enables this functionality.
Use a meaningful name and description for your alert; these bits of information will appear in the operations console, and in the data sent via integrations with other software. Finally, set the Priority and Severity, based on the application's role in your environment (in my case, the paging system for a busy hospital was considered pretty goddamned important, as one could guess).

And there you have it: a nice little logfile scraper in SCOM 2012R2. The monitor will dutifully inspect the logs for indications of errors, and create an alert as soon as one is detected. Of course, we tested the functionality during a scheduled outage of the application. Sure enough, when we shut down part of the application, the handshake failed, and the alert was tripped. Then we gracefully started the application, and the alert auto-closed.
The Conclusion
SCOM 2012R2, in spite of itself, is a perfectly adequate monitoring solution. The problem, though, is that it's only just adequate. Barely adequate, even. If you've got nothing else, use SCOM. If you've got anything else, use that instead.
Application monitoring will always be more valuable to an organization than infrastructure monitoring. And until applications include a contemporary logging method, you can always rely on the tried and true log scraping approach.